Question 92
(Multiple Choice)
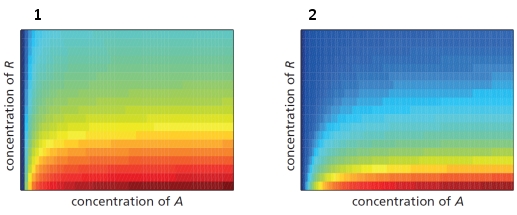
The quantitative output of a gene depends in part on the relative affinities of transcription regulators. In the following graphs, the red color indicates high gene expression and blue color indicates low gene expression. The expression level is plotted as a function of the concentrations of two transcription regulatory proteins, an activator (A) and a repressor (R). Every other parameter being identical, which graph corresponds to a system where the affinity of protein A for the cis?-regulatory sequences is higher than that of protein R? Which graph corresponds to a system that shows a "leakier" expression? 
A) Graph 1; Graph 1
B) Graph 1; Graph 2
C) Graph 2; Graph 1
D) Graph 2; Graph 2
Answer