Question 86
(Short Answer)
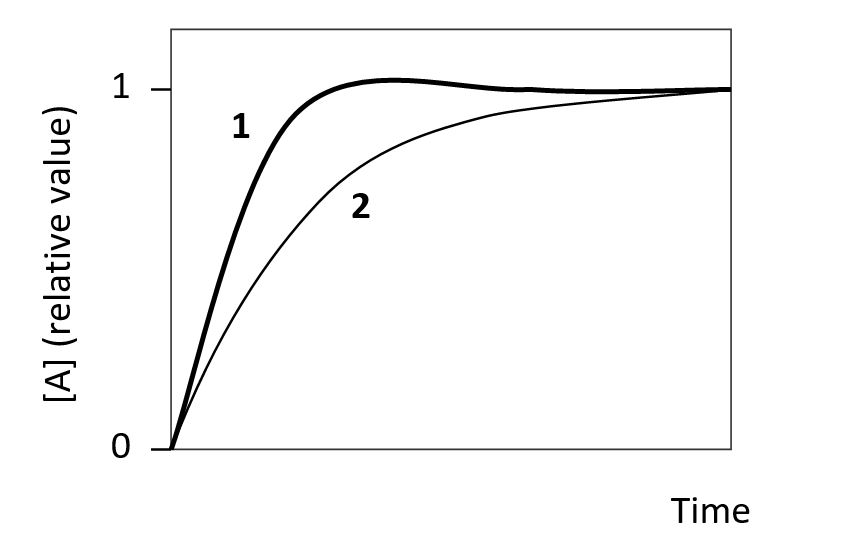
The following graph shows the change in the concentration of a protein (A) over time as a fraction of the final steady-state level. The two curves (1 and 2) in the graph are simulations with similar parameters except that one of them involves a negative feedback loop in which A activates the expression of a repressor protein which in turn represses the expression of A. Which curve (1 or 2) corresponds to the simulation with the negative feedback loop? Write down 1 or 2 as your answer.
Answer
Negative feedback can cause o...
View full Answer