Question 68
(Multiple Choice)
Consider a transcription regulatory protein (A) that can bind to the promoter (p) of a target gene. After reaching an initial steady state, the concentration of A is suddenly increased tenfold. The following graph shows the formation of A:p over time after this change. What is the slope of the curve at time zero? 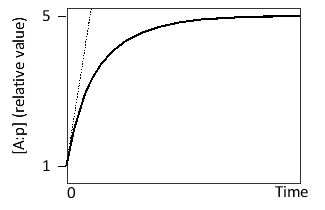
A) 2 kₒff
B) 2 kₒn
C) 5 kₒff
D) 5 kₒn
E) 9 kₒff
Answer