Question 62
(Short Answer)
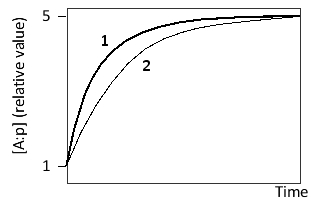
Consider a transcription regulatory protein (A) that can bind to a promoter (p). After reaching an initial steady state, the concentration of A is suddenly increased tenfold. The following graph shows the formation of A:p over time after this change for two systems, one of which is described by higher k?ff and k?n values compared to the other. Which curve (1 or 2) corresponds to this system? Write down 1 or 2 as your answer.
Answer
The system with higher k?ff a...
View full Answer