Question 77
(Multiple Choice)
The following schematic graph shows the result of two quantitative RT-PCR experiments. Total mRNA from two tissue samples (1 and 2) was isolated and subjected to RT-PCR using primers designed to amplify a tissue-specific gene. Added to the reaction was a fluorescent dye that fluoresces only when bound to double-stranded DNA. According to the graph, which tissue has a higher level of this mRNA? By how much? 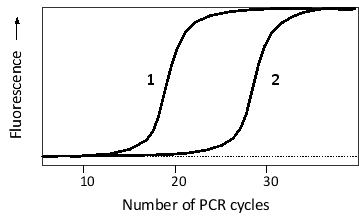
A) About 2-fold higher in tissue 1
B) About 1000-fold higher in tissue 1
C) About 2-fold higher in tissue 2
D) About 1000-fold higher in tissue 2
Answer