Question 50
(Short Answer)
A portion of RNA-seq data obtained from two tissue samples is plotted in the following schematic diagram. Which region (A to E) corresponds to an alternative exon? 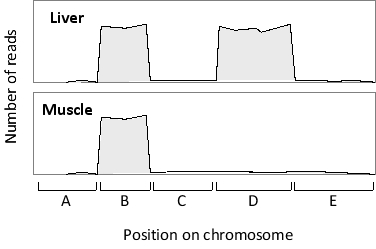
Answer
As shown in this ex...
View full Answer
Question 50
(Short Answer)
Answer
View full Answer