Question 17
(Multiple Choice)
In the following qualitative histogram, which two curves better correspond to human exon and intron length distributions, respectively? 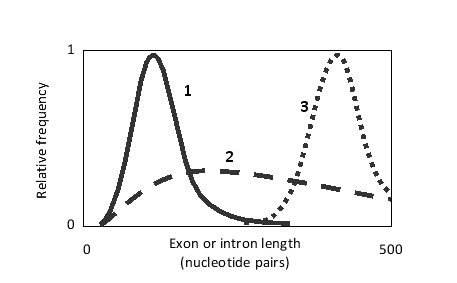
A) Curves 1 and 2
B) Curves 2 and 1
C) Curves 2 and 3
D) Curves 3 and 2
E) Curves 3 and 1
Answer