Question 43
(Short Answer)
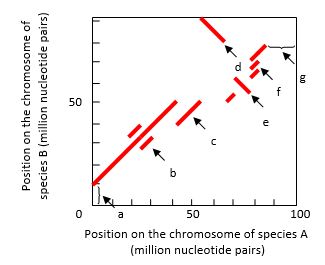
The regions of synteny between the chromosomes of two species can be visualized in dot plots. In the example shown in the following graph, a chromosome of a hypothetical species A has been aligned with the related chromosome in species B. Each dot in the plot represents the observation of high sequence identity between the two aligned chromosomes in a window located at the two corresponding chromosome positions. A series of close dots can make a continuous line. Choosing a sufficiently large window size allows a "clean" dot plot with solid lines that show only the long stretches of identity, allowing ancient large-scale rearrangements to be identified. Several chromosomal events can be detected in such dot plots. Indicate which feature (a to g) in the dot plot is best explained by each of the following events. Your answer would be a seven-letter string composed of letters a to g only, e.g. cdbagef. Each letter should be used only once.
( ) A duplication that exists in both species
( ) A duplication in species A only
( ) A triplication in species B only
( ) An inversion without relocation
( ) An inversion combined with relocation
( ) A deletion in species A
( ) A translocation in species A from a different chromosome
Answer
A diagonal line in this plot indicates...
View full Answer