Question 13
(Multiple Choice)
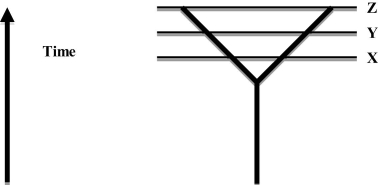 The diagram represents the splitting of one population into two separate lineages that become more different over time (the distance between the two lines represents the amount of difference between the two lineages). Which of the following statements about the two lineages is most accurate?
A) They are more likely to be separate species at time Z than at time X.
B) They are likely to be more different at time X than at time Z.
C) They are more likely to fuse if they start interbreeding at time Z than at time X.
D) There are likely to be more isolating mechanisms at time X than at time Z.
Answer