Question 22
(Multiple Choice)
The eight panels below show average climatic values across the year on a monthly basis, as represented by first letter of each month depicted on the x-axis. Temperature values are depicted as a line graph and represented by the left vertical axis, while precipitation values are depicted as a bar graph and represented by the right vertical axis. 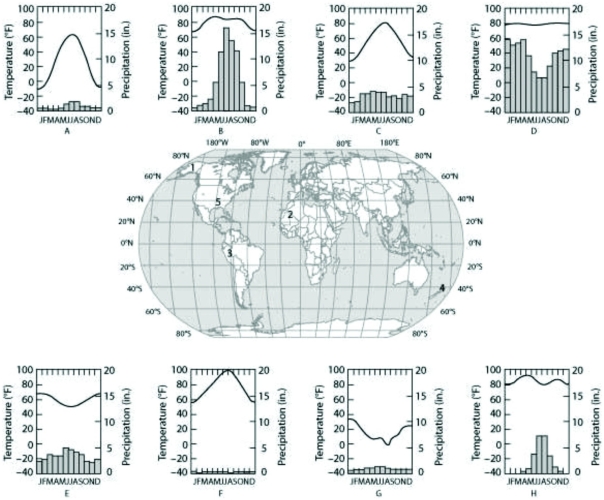 Which panel (A-H) most likely depicts the climate for location 5 as shown on the map in the center panel?
A) A
B) B
C) D
D) H
Answer