Question 58
(Multiple Choice)
The graph shown below diagrams the number of cases of a disease versus time. The high peak near the right-hand side would be considered a(n) 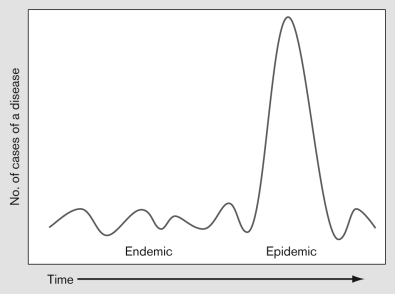
A) prevalence.
B) incidence.
C) endemic.
D) epidemic.
E) pandemic.
Answer
Question 58
(Multiple Choice)
Answer