Question 30
(Multiple Choice)
The figure below shows the mass to charge ratios of two pathogenic Neisseria sp. The molecule being measured is ________ and the technique being used is ________. 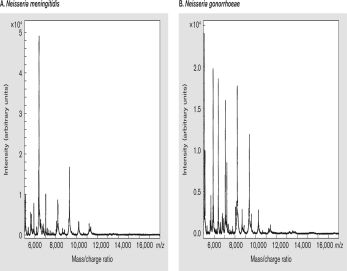
A) protein; riboswitch sensor
B) protein; MALDI-TOF-MS
C) DNA; riboswitch sensor
D) DNA; MALDI-TOF-MS
E) RNA; riboswitch sensor
Answer