Question 65
(Essay)
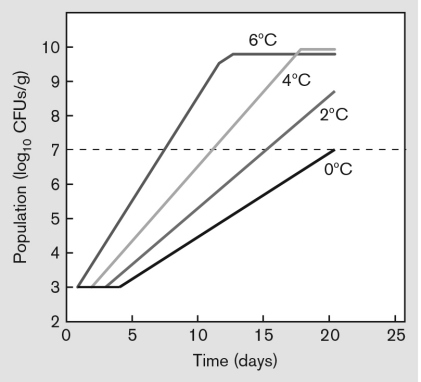
The graph below shows an experiment in which growth of aerobic bacteria in ground beef (CFUs/g) was measured at different refrigeration temperatures. Interpret the graph and explain what the dotted line represents.
Answer
The growth rate of total aerobic bacteri...
View full Answer