Question 70
(Multiple Choice)
The following questions refer to Figure 53.3, which depicts the age structure of three populations.
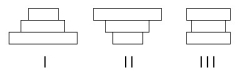
Figure 53.3
-Assuming these age-structure diagrams describe human populations, which population(s)is (are)likely to experience zero population growth (ZPG)?
A) I
B) II
C) III
D) I and II
E) II and III
Answer