Question 69
(Multiple Choice)
Figure 37.1 shows the results of a study to determine the effect of soil air spaces on plant growth.
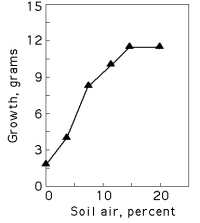
Figure 37.1
-The best explanation for the shape of the growth response curve in Figure 37.1 is that
A) the plant requires air in the soil for photosynthesis.
B) the roots are able to absorb more nitrogen (N₂) in high levels of air.
C) most of the decrease in weight at low air levels is due to transpiration from the leaves.
D) increased soil air produces more root mass in the soil but does not affect the top stems and leaves.
E) the roots require oxygen for respiration and growth.
Answer