Question 78
(Multiple Choice)
Which graph below best represents the way that density changes over time in a physoclistus fish and in a physostomus fish, respectively?
A. 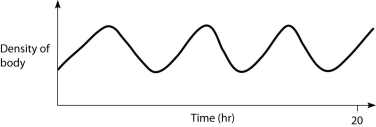
B. 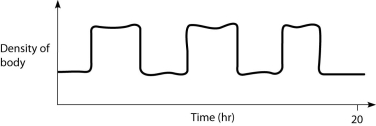
C. 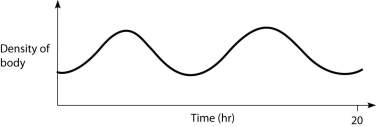
D. 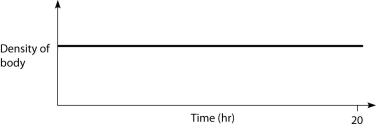
A) A and B
B) B and A
C) B and C
D) C and B
E) D and B
Answer