Question 49

(Multiple Choice)

Consider the thermoacidophile, Sulfolobus acidocaldarius. Which of the following graphs most accurately depicts the expected temperature and pH profiles of its enzymes? (Note: The horizontal axes of these graphs are double, with pH above and temperature below.)
Consider the thermoacidophile, Sulfolobus acidocaldarius. Which of the following graphs most accurately depicts the expected temperature and pH profiles of its enzymes? (Note: The horizontal axes of these graphs are double, with pH above and temperature below.)   A)   B)   C)   D)
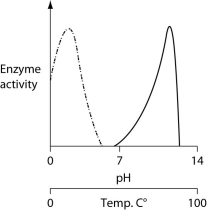
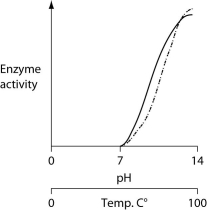
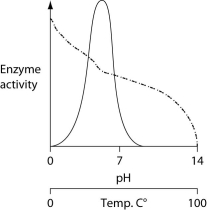
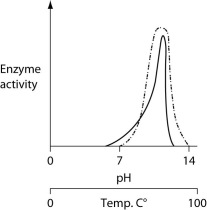

A) Consider the thermoacidophile, Sulfolobus acidocaldarius. Which of the following graphs most accurately depicts the expected temperature and pH profiles of its enzymes? (Note: The horizontal axes of these graphs are double, with pH above and temperature below.)   A)   B)   C)   D)
B) Consider the thermoacidophile, Sulfolobus acidocaldarius. Which of the following graphs most accurately depicts the expected temperature and pH profiles of its enzymes? (Note: The horizontal axes of these graphs are double, with pH above and temperature below.)   A)   B)   C)   D)
C) Consider the thermoacidophile, Sulfolobus acidocaldarius. Which of the following graphs most accurately depicts the expected temperature and pH profiles of its enzymes? (Note: The horizontal axes of these graphs are double, with pH above and temperature below.)   A)   B)   C)   D)
D) Consider the thermoacidophile, Sulfolobus acidocaldarius. Which of the following graphs most accurately depicts the expected temperature and pH profiles of its enzymes? (Note: The horizontal axes of these graphs are double, with pH above and temperature below.)   A)   B)   C)   D)

Answer