Question 65
(Multiple Choice)
The next questions refer to the following table, which compares the % sequence homology of four different parts (two introns and two exons) of a gene that is found in five different eukaryotic species. Each part is numbered to indicate its distance from the promoter (e.g., Intron I is the one closest to the promoter). The data reported for species A were obtained by comparing DNA from one member of species A to another member of species A.
% Sequence Homology
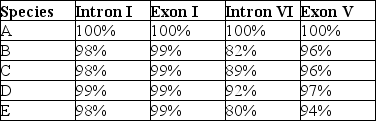
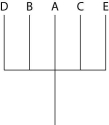
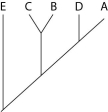
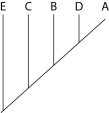
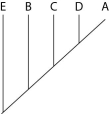
-Based on the tabular data, and assuming that time advances vertically, which cladogram (a type of phylogenetic tree)is the most likely depiction of the evolutionary relationships among these five species?
A)
B)
C)
D)
Answer