Question 59
(Multiple Choice)
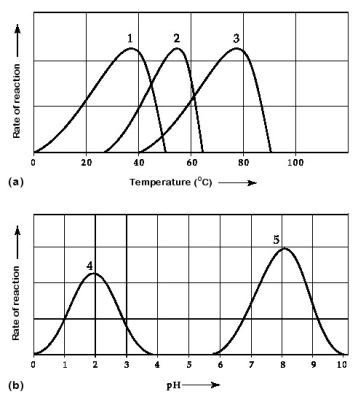
Activity of various enzymes at various temperatures (a) and at various pH (b).
-Which temperature and pH profile curves on the graphs were most likely generated from analysis of an enzyme from a human stomach where conditions are strongly acid?
A) curves 1 and 4
B) curves 1 and 5
C) curves 2 and 4
D) curves 2 and 5
E) curves 3 and 4
Answer