Question 110
(Multiple Choice)
Which diagram and picture in the figure best represents the results obtained when placing red blood cells into a normal saline solution (0.9% NaCl)? 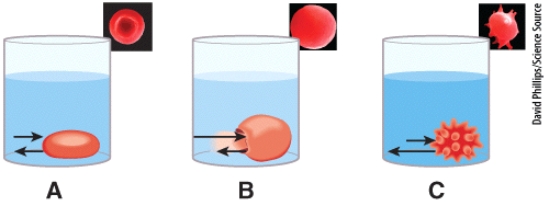
A)A
B)B
C)C
D)None of the choices is correct.
E)All of the choices are correct.
Answer