Question 1
(Short Answer)
Figure 29.1
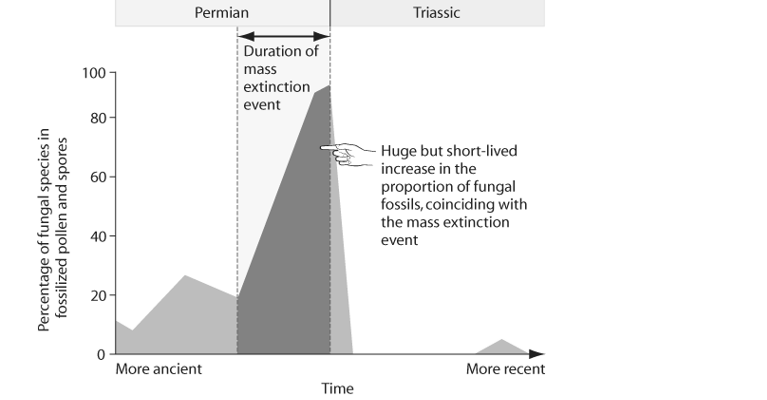
-Looking at Figure 29.1, draw a new graph that plots the percentage of plant species in the fossil pollen and spore record, and write a figure legend comparing it to the original figure.
Answer
Inverse of figure values