Question 11
(Multiple Choice)

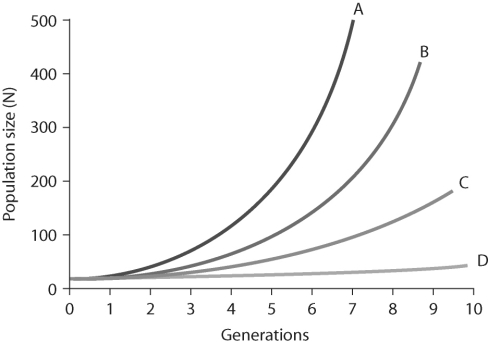 Figure 51.4
-In the figure above, which of the lines represents the highest per- capita rate increase r)?
A) line A
B) line B
C) line C
D) line D
Answer